Trade-data research is easier to review when teams organize it around the decision being considered, then keep sources, definitions, extracts, and interpretations in clearly labeled layers. This structure prevents an old chart or an undocumented query from being mistaken for current evidence.
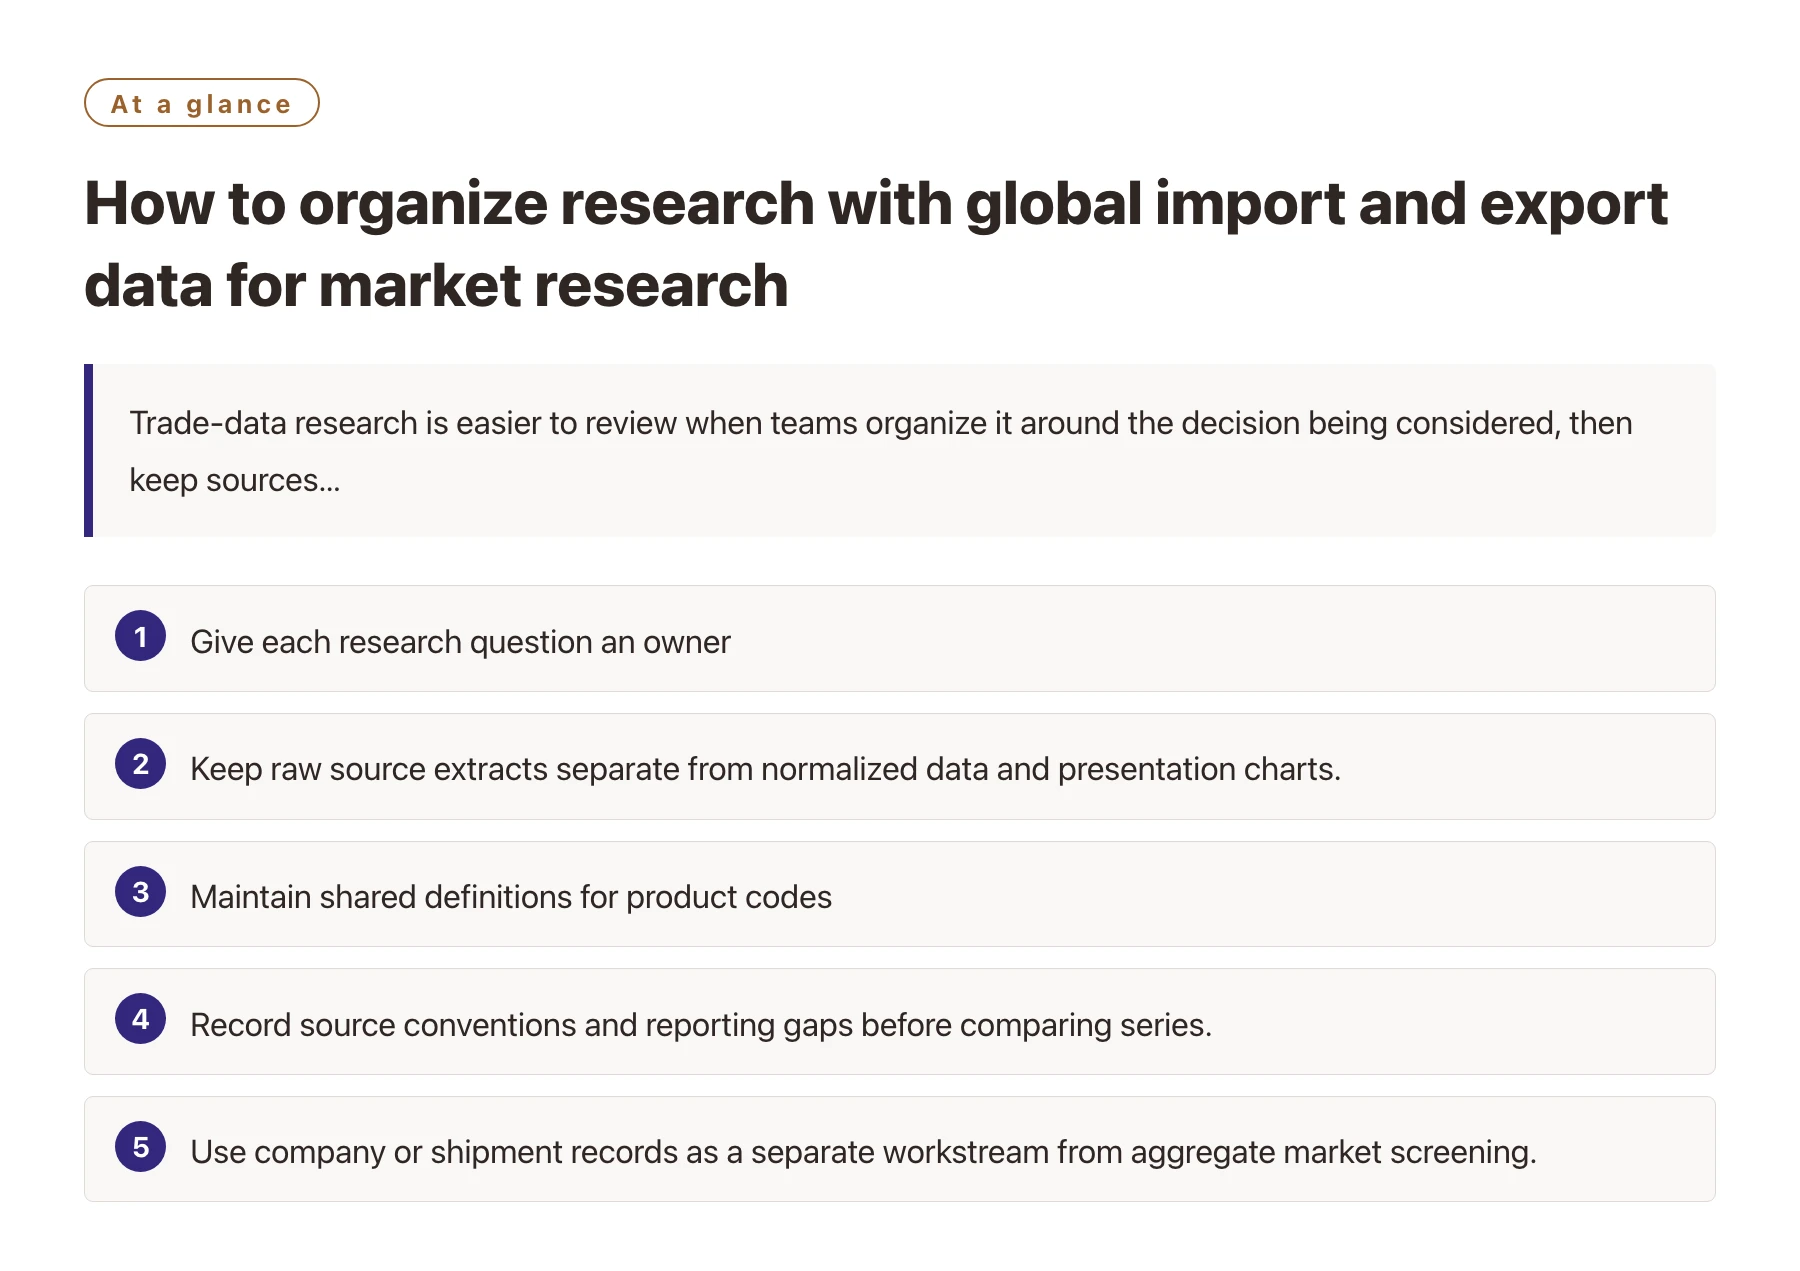
Key takeaways
- Give each research question an owner, decision, scope, and next action.
- Keep raw source extracts separate from normalized data and presentation charts.
- Maintain shared definitions for product codes, geography, periods, units, and terms.
- Record source conventions and reporting gaps before comparing series. [1]
- Use company or shipment records as a separate workstream from aggregate market screening.
When several people contribute to market research, the main organizational risk is not a lack of files. It is losing the connection between a file and the question it was meant to answer. A spreadsheet may contain a useful result, but without its source, query, product mapping, and date, nobody can tell whether it still applies.
The framework below treats the research project as a small evidence system. It works whether the team uses public trade statistics, company-oriented records, or a mix of sources. The objective is to make it clear which outputs are raw observations, which are analyst transformations, and which are recommendations.
1. Create a project index before collecting data
Open with a short index that states the business question, decision owner, scope, status, and planned deliverable. Use one line for each question rather than one broad heading for the entire market. A supplier search, a destination screen, and a product-code review may belong to one project but need distinct definitions and owners.
Each line should identify what is in scope and what is excluded. For instance, specify whether a product family includes parts, materials, or finished goods; whether the analysis covers imports, exports, or both; and whether the intent is to find economies for further review or named organizations for outreach.
Add a next-action field and a due date for the evidence needed. The purpose is not project administration for its own sake. It keeps the research from ending at a dashboard when a decision-maker still needs to know who will verify the result.
2. Separate source evidence from working analysis
Use a clear folder or workspace structure with at least three layers: original source extracts, analyst-created working files, and presentation outputs. Preserve the original file as received. If a source does not provide a downloadable extract, save the query parameters, page, API request details where appropriate, and retrieval date.
In the working layer, keep transformations reproducible. Maintain a separate file for code crosswalks, name normalization, unit conversion, deduplication, and exclusions. Each transformation should have a short explanation and, when possible, a simple check that shows how many records were affected.
Presentation charts should point back to a working table and source extract. Include the period, unit, product scope, geography, and retrieval date in the chart note or linked research record. This makes it harder for a screenshot to travel around the company without the assumptions that make it interpretable.
3. Maintain a shared vocabulary and definitions
Teams should agree on labels for reporter, partner, import, export, re-export, shipment date, customs date, value, quantity, and company entity. Two analysts may use the same word to mean different fields. A short glossary prevents those differences from spreading into combined charts.
For product scope, preserve both commercial language and classification language. The commercial name reflects what the business sells; the code and official description reflect the statistical or customs grouping. Keep a mapping note that includes code level, revision, relevant geography, and unresolved boundary questions.
Geographic fields also need careful names. A reporting economy, a partner, a port, and a destination market are not interchangeable. Label them explicitly in tables and dashboards so that the user does not infer a route or end market from a field that only represents the reporting context.
4. Keep source conventions alongside each dataset
For each source, create a short profile that records coverage, trade system, valuation basis, units, time frequency, revision practice, and known limitations. The WTO technical notes describe, for example, differences between general and special trade systems and explain why methods affect merchandise trade series. Keeping such conventions near the extract helps reviewers interpret changes correctly. [1]
Official data portals may offer several products for the same country. The U.S. Census Bureau’s international trade resources include separate views by classification, geography, time series, and data product. Record the specific table or resource used rather than simply naming the agency. [2]
When combining sources, do not flatten their differences into a single “global” table without documenting the join logic. Keep the source field on every observation and note whether one source is a direct report, an estimate, or a company-level record. Review discrepancies rather than hiding them.
5. Divide the research into linked workstreams
A market screen and a company search should usually be separate workstreams with a clear handoff. The market screen identifies geographies or product categories that merit attention. The company workstream tests whether relevant buyers, suppliers, distributors, or logistics firms can be identified and verified.
For company research, save the original record name, normalized name, matching rationale, source date, and identity evidence. Flag unresolved matches rather than forcing them into a definitive company profile. Shipment-level information can identify candidates to investigate, but it does not necessarily establish current intent, suitability, or a complete company relationship.
If the team needs a searchable platform for TradeData Pro, evaluate it against one of the defined workstreams. A market screen may require broad geography and time series, while a supplier review may depend on entity detail and product descriptions. Test sample records for the relevant task and keep platform results identified as their own source layer.
6. Use a decision log to connect evidence with action
A decision log records what the team concluded, what evidence supported it, which assumptions remain, and what action follows. Keep the conclusion narrow. A country that advances to further research is not automatically an approved market; a company name that appears in a record is not automatically a qualified lead.
When a decision changes, record why. New data, a corrected product mapping, customer interviews, regulatory review, or a revised budget may all change the recommendation. This history helps later analysts understand why a previous market was selected or set aside without repeating the entire project.
Use a limitations field in the log. Include missing periods, broad codes, reporting changes, unresolved bilateral differences, and uncertain entity matches when relevant. The limitations are part of the evidence and should travel with the recommendation.
7. Make updates predictable
Assign a refresh trigger based on the question: a new release, a strategic planning cycle, a classification revision, or a change in the company’s target product. If the source publishes at a known cadence, include that cadence in the project note; otherwise, avoid promising that an extract is current on a schedule that has not been verified.
When refreshing, keep the old extract and add the new retrieval date. Compare what changed in values, coverage, definitions, and records. A revised result may reflect a source correction rather than a shift in the underlying trade pattern. A short change note prevents the team from attributing every difference to the market.
Good organization makes the research portable. Another analyst should be able to locate the question, reproduce the query, understand the product mapping, review the evidence, and see the next action without relying on the memory of the original researcher.
Sources
Frequently asked questions
How should a team organize trade-data research files?
Separate original source extracts, analyst-created transformations, and presentation outputs, and link every result to its query, date, definitions, and source.
Why keep company research separate from market screening?
Aggregate trade statistics and company records answer different questions. Separating them prevents a market signal from being treated as proof about a named organization.
What belongs in a trade-data decision log?
The conclusion, evidence, assumptions, limitations, unresolved questions, and next action.
How should teams handle updated statistics?
Save the new retrieval date and preserve the prior extract, then document changes in values, definitions, coverage, and revisions.