Trend Surfing vs Deep Search on NSFW AI Directories
A ranked list and a search box answer different questions, and confusing the two is the usual reason a long browsing session ends with nothing saved. Crushon publishes a 20-character chart that is rebuilt every Thursday, while its search reaches any tag in the catalogue, so the first decision is which of the two your question belongs to.

Key takeaways
- The chart is a consensus signal: 20 ranked cards, rebuilt every Thursday, each carrying a view counter and a favourite counter.
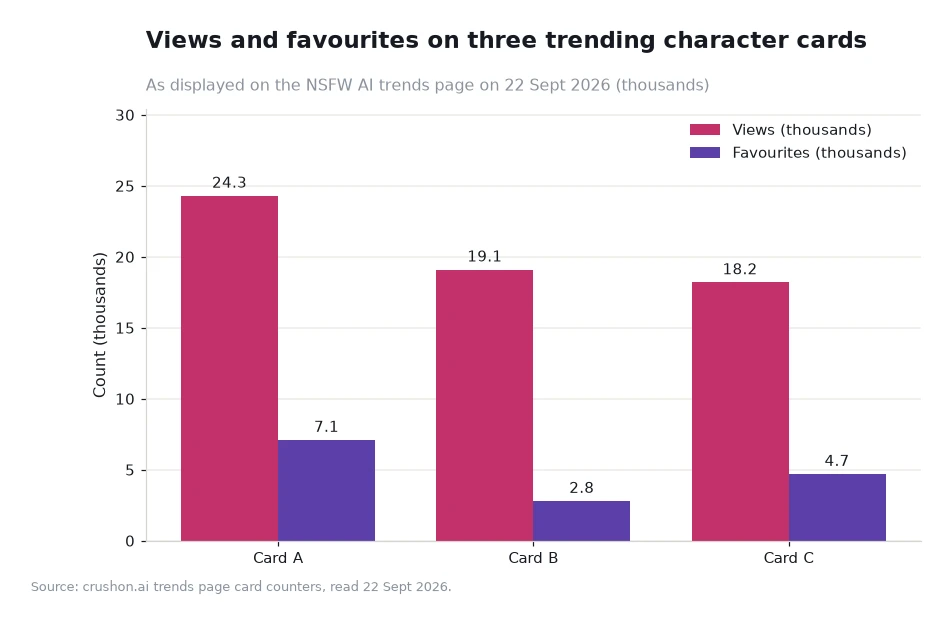
- Favourites divided by views separates passing traffic from deliberate interest — 7.1K against 24.3M is about 0.029%.
- Search wins the moment you can name a trait; the chart wins while you still cannot name one.
- A ten-minute block covers one route properly, not both.
What the weekly chart measures, and what it does not
The trends list is an ordering of 20 NSFW AI characters, rebuilt once a week on a Thursday. Each card carries two counters, total views and total favourites, along with tags such as Unfiltered, Submissive, Fictional, OC or Female, and the creator's name printed underneath. That is a popularity snapshot with a small amount of context attached, and it is genuinely useful as long as you remember what produced the ordering.
Order comes from other readers' behaviour, which means the chart answers "what is broadly liked" rather than "what matches this particular interest of mine". It cannot explain why a card holds its position. A 24.3M view count may have accumulated slowly across months, while an 18.2M count on a newer card may reflect a sharper burst of attention. The card itself does not separate those two stories, which is why the second counter deserves more attention than it usually gets.
Reading the favourite counter as a ratio
A favourite is a deliberate act rather than a page view, so the ratio between the two counters is a rough proxy for how many readers decided a character was worth keeping. Ratios computed from the counters published on 22 Sept 2026 give a clearer picture than the raw ordering does.
Eri, the leading card, displays 24.3M views and 7.1K favourites: 7,100 ÷ 24,300,000 is about 0.029%. Eva shows 19.1M views and 2.8K favourites, or about 0.015%. Takara stands at 18.2M views and 4.7K favourites, roughly 0.026%. The ranking order and the ratio order do not match. Takara ranks third on views but converts a larger share of its audience into saves than Eva, the second-placed card, does.
This is not a quality score, and it should not be read as one. It is a way of asking whether a card's audience engaged or merely passed through, and it gives you one signal more than a bare count can when two thumbnails look equally plausible.
A third use for the ratio is comparison across weeks, and this is where the Thursday refresh earns its keep. A card whose view count climbs by millions while its favourite count barely moves is being shown widely and kept rarely; a card whose favourite count rises faster than its views is being read closely by a smaller audience. Neither pattern is better in the abstract. The counters move independently, and watching both across several Thursdays tells you more than any single week's snapshot can.
When search beats the chart
The chart holds 20 entries per week. Search holds whatever the tag system holds. If your interest is narrow — a scenario style, an archetype, a voice with a specific register — the ranking is the wrong instrument, because the probability that one of 20 ranked cards matches a narrow filter in the same week is low.
A practical test before you open anything: if you can describe the trait you want in roughly three words, go to search; if you cannot, open the chart and use the card tags as vocabulary. The phrases printed on the cards are the ones the catalogue is indexed with, which makes the ranking an unusually efficient dictionary for a first visit.
| Question you are asking | Route that answers it | The number that decides |
|---|---|---|
| What is broadly liked this week? | Weekly chart | 20 ranked cards, rebuilt each Thursday |
| Which cards get kept, not just seen? | Both counters on a card | 7.1K ÷ 24.3M is about 0.029% |
| Is the third-place card worth opening? | Ratio, not position | 4.7K ÷ 18.2M is about 0.026%, above the second card |
| Does a tag I have in mind exist? | Character search | Filtered, Unfiltered and 18+ filters plus the tag list |
| Who produces the most-kept characters? | Creator leaderboard | Creators and Characters boards, refreshed weekly |
Worked example: one ten-minute pass
Illustrative assumption: you have ten minutes, no named trait, and a shortlist you actually want to use. Reading all 20 cards at 15 seconds each costs 300 seconds, or five minutes, and that is enough to scan a tag row and both counters. The same five minutes, 300 seconds, is the budget for the three cards that survive the scan.
Suppose the three survivors are Eri, Eva and Takara. Opening a card and reading its description takes about 60 seconds, so 3 × 60 = 180 seconds, leaving 600 − 300 − 180 = 120 seconds for a first exchange with whichever one appealed most. Add the numbers: 300 + 180 + 120 = 600 seconds, exactly the ten minutes you started with. Had you instead begun with a named trait and gone straight to search, the same ten minutes would have covered fewer cards but at a much tighter fit, which is often the better trade.
Choosing deliberately instead of aimlessly
Crushon files its weekly list under the label nsfw ai chat, and because the order only moves on Thursdays, one visit a week tells you everything a daily visit would. The new cards on that list are also worth reading as an index of tags: if a phrase appears on several cards, it is part of the vocabulary the catalogue actually uses, and it will work in the character search box later.
Keep the shortlist short. Three cards you will actually return to beat twenty you will not, and the weekly rankings page will still be there next Thursday if the shortlist turns out to be wrong.
Two mistakes recur often enough to name. The first is treating a chart position as a recommendation, which it is not — it is an aggregate of other readers' decisions, made for reasons you cannot see. The second is assuming the chart is the catalogue. It is a 20-slot window on something far larger, and search is the only route that reaches what the window leaves out.
Frequently asked questions
Does a higher view count mean a better character?
No. Views accumulate over time and across audiences, so a card can rank high simply because it has been listed longer. The favourites-to-views ratio, such as 7.1K against 24.3M, says more about deliberate engagement than position does.
Why does the ranking look unchanged in the middle of the week?
Because it is rebuilt on Thursdays only. Positions seen on Monday are the same on Wednesday, so browsing daily inside a single week adds no new ordering information.
Should I use search or the chart first?
Use the chart when you cannot name what you want, because 20 cards supply the tag vocabulary. Use search when you can name it, because a specific trait is unlikely to appear among the 20 ranked entries in the same week.
Match the route to the question
Write the question down before opening a tab, because "show me what is popular" and "find something with this trait" lead to different pages with different costs. Surfing the chart is cheap per card and expensive in total; searching by tag is expensive to phrase and cheap once the phrase is right. Most readers who describe browsing as frustrating have been using one route for both questions.
Data and sources: card counters, tag labels and filter names as displayed on the Crushon trends and search pages[1], read 22 Sept 2026. Ratios are arithmetic on those published counters; the ten-minute split is an illustrative assumption, not platform data. Written for readers aged 18 and over.